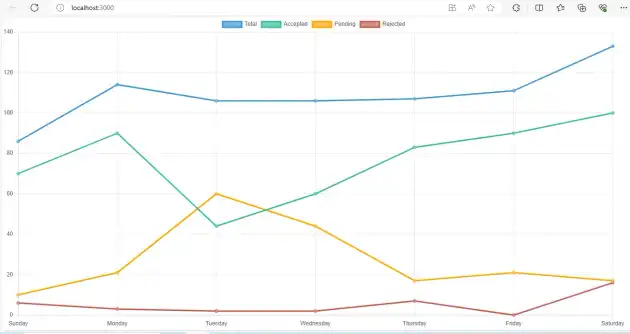
How to add chart in react js?
May 01, 2024Hi Friends 👋,
Welcome To aHoisting!
To add chart in react js, you can use <LineChart />. It will add chart in react js.
Today, I am going to show you, how to add chart in react js.
Table of contents
- Install and create a new React app.
- Install Chart.js.
- Import react component.
- Create a Component.
Chart.js is a package that uses canvas elements to render animated, responsive charts. There are nine different types of charts available for Chart.js.
Let’s start with the first step.
Step 1: Install and create a new React app.
First you have to install the React project. You should use create-react-app command to create a new React project.
npx create-react-app my-app
cd my-app
npm start
Step 2: Install Chart.js.
You have to install chart.js command in react js.
npm install chart.js
Step 3: Import react component.
After installing, you have to import your React component. To do this, add the following line to the top of your component file.
import React, { Component } from 'react';
import Chart from 'chart.js/auto';
import LineChart from "./LineChart.js";
Step 4: Create a Component.
you can use style={{padding: '10px'}} to add chart in react js.
<div>
	<canvas
	id="myChart"
	ref={this.chartRef}
	/>
</div>
Define the add chart example.
The below code is an example of a React. You have to import React and use <LineChart /> to add chart in react js.
App.js
import LineChart from "./LineChart.js";

export default function App() {
    return (
      <div>
        <LineChart />
      </div>
    );
}
./LineChart.js
import React, { Component } from 'react';
import Chart from 'chart.js/auto';

export default class LineChart extends Component {

	chartRef = React.createRef();

	componentDidMount() {

    let chartStatus = Chart.getChart("myChart"); // <canvas> id
    if (chartStatus != undefined) {
      chartStatus.destroy();
    }

		const ctx = this.chartRef.current.getContext("2d");

		new Chart(ctx, {
			type: "line",
			data: {
				labels: ["Sunday", "Monday", "Tuesday", "Wednesday", "Thursday", "Friday", "Saturday"],
				datasets: [{
					data: [86,114,106,106,107,111,133],
					label: "Total",
					borderColor: "#3e95cd",
					backgroundColor: "#7bb6dd",
					fill: false,
				}, {
					data: [70,90,44,60,83,90,100],
					label: "Accepted",
					borderColor: "#3cba9f",
					backgroundColor: "#71d1bd",
					fill: false,
				}, {
					data: [10,21,60,44,17,21,17],
					label: "Pending",
					borderColor: "#ffa500",
					backgroundColor:"#ffc04d",
					fill: false,
				}, {
					data: [6,3,2,2,7,0,16],
					label: "Rejected",
					borderColor: "#c45850",
					backgroundColor:"#d78f89",
					fill: false,
				}
				]
			},
		});
	}
	render() {
		return (
			<div>
				<canvas
				id="myChart"
				ref={this.chartRef}
				/>
			</div>
			)
	}
}
In the above code example, I have used the <LineChart /> and add chart in react js.
Check the output of the above code example.
All the best 👍
