How to create bar chart in react js?
November 10, 2024Hi Friends 👋,
Welcome To aHoisting!
To create bar chart in react js, you can use 'chart.js' , react-chartjs-2 and BarChart package. It will create bar chart in react js.
Today, I am going to show you, how to create bar chart in react js.
Installation
Install the following packages to use bar chart in react js.
npm
npm install react-chartjs-2 chart.js
yarn
yarn add react-chartjs-2 chart.jsTable of contents
- Install and create a new React app.
- Import react component.
- Create a Component.
Let’s start with the first step.
Step 1: Install and create a new React app.
First you have to install the React project. You should use create-react-app command to create a new React project.
npx create-react-app my-app
cd my-app
npm start
Step 2: Import react component.
After installing, you have to import your React component.
import React from 'react';
import BarChart from './BarChart';
Step 3: Create a Component.
You can use <BarChart /> to create bar chart in react js.
<div className="App">
  <h1>Bar Chart Example</h1>
    <BarChart />
 </div>
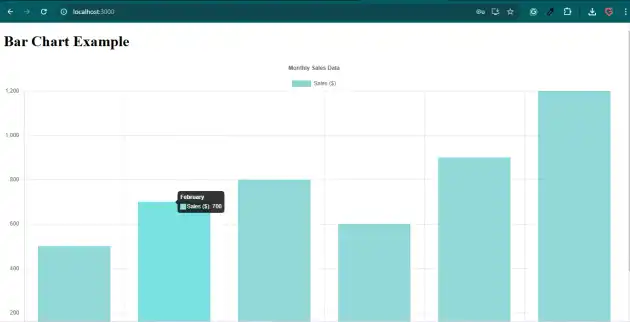
Create bar chart example.
The below code is an example of a React. You have to import 'react-chartjs-2' and use 'chart.js', react-chartjs-2 and BarChart package to create bar chart in react js.
App.js
import React from 'react';
import BarChart from './BarChart';

function App() {
  return (
    <div className="App">
      <h1>Bar Chart Example</h1>
      <BarChart />
    </div>
  );
}

export default App;
BarChart.js
import React from 'react';
import { Bar } from 'react-chartjs-2';
import {
  Chart as ChartJS,
  CategoryScale,
  LinearScale,
  BarElement,
  Title,
  Tooltip,
  Legend,
} from 'chart.js';

ChartJS.register(
  CategoryScale,
  LinearScale,
  BarElement,
  Title,
  Tooltip,
  Legend
);

function BarChart() {
  // Sample data for the chart
  const data = {
    labels: ['January', 'February', 'March', 'April', 'May', 'June'],
    datasets: [
      {
        label: 'Sales ($)',
        data: [500, 700, 800, 600, 900, 1200],
        backgroundColor: 'rgba(75, 192, 192, 0.6)',
        borderColor: 'rgba(75, 192, 192, 1)',
        borderWidth: 1,
      },
    ],
  };

  // Chart options (optional)
  const options = {
    responsive: true,
    plugins: {
      legend: {
        position: 'top',
      },
      title: {
        display: true,
        text: 'Monthly Sales Data',
      },
    },
  };

  return <Bar data={data} options={options} />;
}

export default BarChart;
In the above code example, I have used the react-chartjs-2 to create bar chart in react js.
Check the output of the above code.
All the best 👍
